
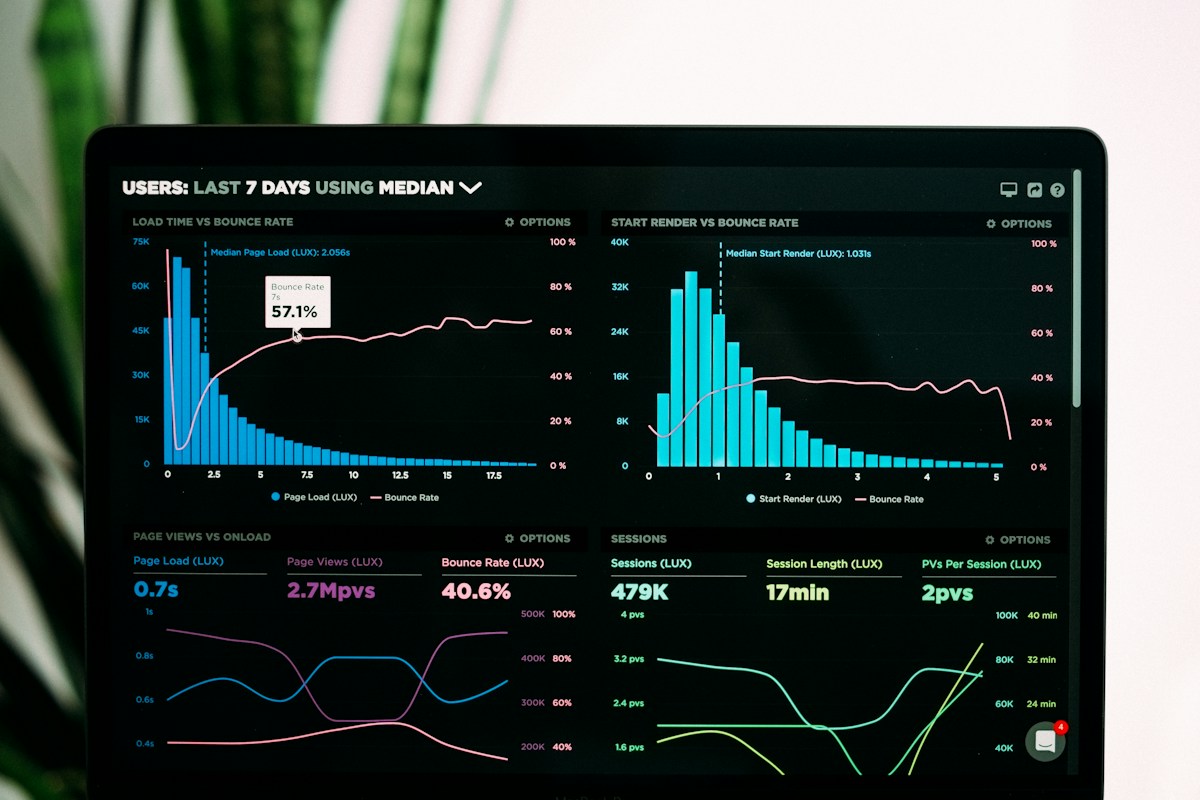
Photo via Unsplash
Google’s Core Web Vitals have matured. The metrics are stable, the tooling is excellent, and the SEO signal is real. But many teams are still chasing the wrong optimizations — spending weeks on things that don’t move their scores while missing the three changes that would get them to green in a week.
This is what we’ve learned auditing over 50 production sites across SaaS, e-commerce, and content platforms.
The Three Metrics That Actually Matter
Before we get into tactics, a refresher on what you’re optimizing:
LCP (Largest Contentful Paint) — how quickly the main content renders. This is almost always the hardest metric to fix and the one with the highest business impact. Target: under 2.5 seconds.
INP (Interaction to Next Paint) — how responsive the page feels to user input. Replaced FID in 2024 and is significantly harder to game. Target: under 200ms.
CLS (Cumulative Layout Shift) — visual stability. Content shouldn’t jump around as the page loads. Target: under 0.1.
The Highest-ROI Optimizations
These are the changes that consistently deliver the biggest improvement per hour of engineering effort:
What Doesn’t Work (That Everyone Tries)
Lazy loading everything. Lazy loading images below the fold is correct. Lazy loading your hero image is actively harmful — it delays LCP. We regularly see developers apply loading="lazy" to every image on the page as a blanket optimization. Don’t.
Compressing images without fixing their dimensions. Serving a 4000×3000px image at 300×200px CSS display size wastes bandwidth regardless of compression quality. Fix the dimensions in your image pipeline first.
Adding more caching without identifying what’s slow. Caching a slow page makes a slow page marginally faster. It doesn’t fix the root cause. Profile first, cache after.
Chasing Lighthouse scores on desktop. Lighthouse desktop scores are almost always 20–30 points higher than mobile, and mobile is what Google measures for ranking. Always audit on Simulated Mobile in Chrome DevTools.
| Optimization | LCP Impact | INP Impact | CLS Impact | Effort |
|---|---|---|---|---|
| Preload LCP asset | 🔴 High | ⬜ None | ⬜ None | Low (1–2h) |
| Move render-blocking scripts | 🔴 High | 🟡 Medium | ⬜ None | Low (2–4h) |
| Modern image formats | 🟡 Medium | ⬜ None | ⬜ None | Medium (1d) |
| Fix layout shift sources | ⬜ None | ⬜ None | 🔴 High | Low (2–4h) |
| Code split JS bundles | 🟡 Medium | 🔴 High | ⬜ None | High (1–2w) |
| Font display: swap | 🟡 Medium | ⬜ None | 🟡 Medium | Low (1h) |
| HTTP/3 + CDN | 🟡 Medium | ⬜ None | ⬜ None | Medium (2d) |
Impact ratings based on median improvement observed across audited sites
The Audit Process We Use
When we do a performance engagement, this is the sequence:
- Baseline measurement — real user data from CrUX (Google’s field data), not just Lighthouse lab scores. These can differ dramatically.
- Waterfall analysis — Chrome DevTools Network panel, looking at the critical path and identifying blocking resources.
- Long Task audit — Performance panel, identifying main thread bottlenecks.
- Image audit — checking formats, dimensions, and lazy-loading logic.
- Third-party audit — identifying external scripts that delay LCP.
- Prioritized remediation plan — ordered by impact × effort.
Framework-Specific Notes
Next.js: The Image component handles most image optimization automatically. The main issue we encounter is teams not using it — or using it wrong (no priority prop on above-the-fold images).
React SPA (CRA / Vite): These have the worst starting-point CWV scores of any framework. The main issue is SSR absence — the browser downloads a nearly empty HTML document before anything can render. Consider migrating to Next.js or adding a static pre-render step.
WordPress: The biggest gains are almost always: defer third-party scripts, configure a caching plugin correctly, and use a CDN. The WordPress ecosystem has good tooling for this (WP Rocket, Cloudflare).
What Good Looks Like
A well-optimized production site should target:
- LCP: < 1.8s on mobile (green is < 2.5s, but top-ranking sites are well below that)
- INP: < 150ms (green is < 200ms)
- CLS: < 0.05 (green is < 0.1)
Getting to these numbers from a typical starting point usually takes 2–4 weeks of focused effort. The work is unglamorous but the results — faster pages, better rankings, higher conversion — are measurable within 30 days.